Patterns of Deposit Behavior Linked to Reward Structures in State-Regulated Sports Wagering Apps
Parker Sullivan · Jul 25, 2026
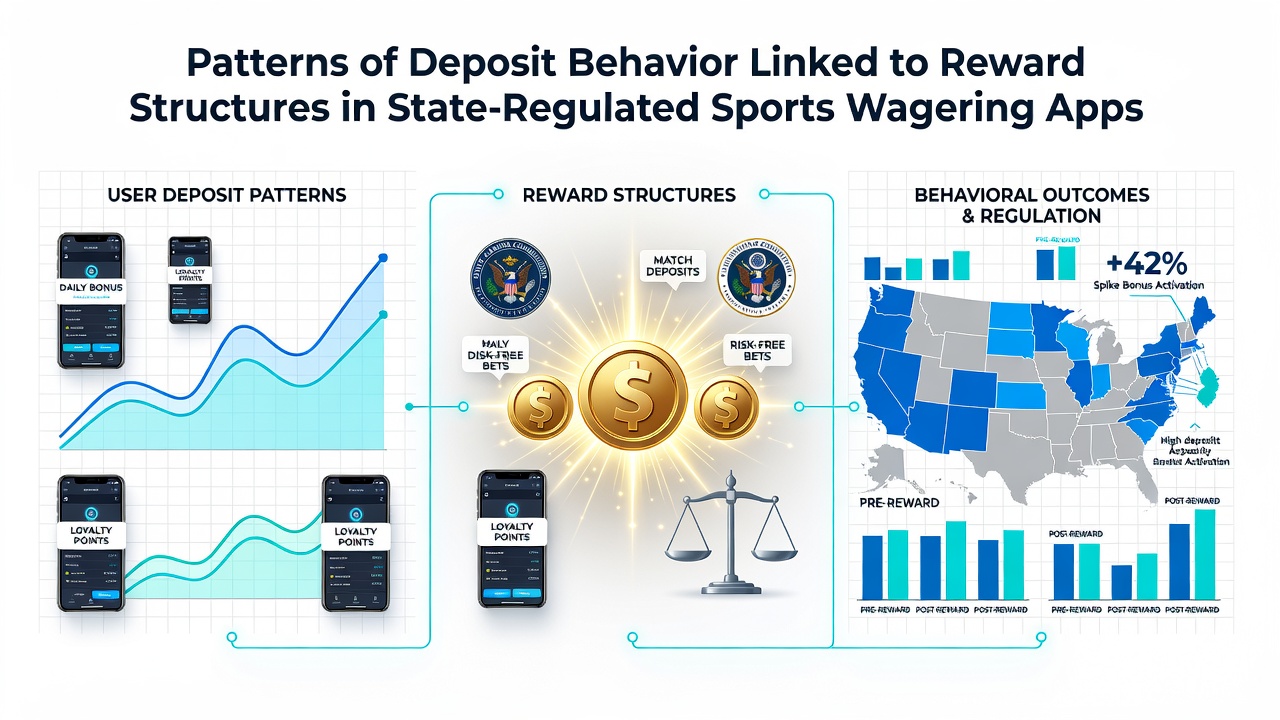
Patterns of Deposit Behavior Linked to Reward Structures in State-Regulated Sports Wagering Apps
State-regulated sports wagering apps have developed reward structures that include deposit matches, tiered loyalty points, and cashback offers, and these mechanisms connect directly to measurable shifts in how users fund their accounts, according to data compiled by multiple gaming commissions through mid-2026. Observers note that deposit patterns often cluster around the activation thresholds for these rewards, creating predictable spikes that regulators track across platforms licensed in states such as New Jersey, Pennsylvania, and Illinois.
Research from the American Gaming Association indicates that users who receive a 100 percent deposit match up to a set limit tend to increase their initial funding amounts by an average of 40 percent compared with periods when no such promotion runs, and this adjustment occurs because the structure effectively lowers the perceived cost of the deposit while raising the available balance for immediate wagering. Those patterns hold steady across demographic groups, though frequency rises more sharply among users who have already completed one reward cycle and qualify for the next tier.
Deposit Timing and Reward Thresholds
Patterns emerge most clearly when reward structures set minimum deposit requirements that unlock additional benefits, and users respond by timing their transfers to hit those marks precisely. Data released in July 2026 from the New Jersey Division of Gaming Enforcement shows that deposits of exactly $50 and $100 occur at rates 2.3 times higher than other amounts during active promotion windows, while amounts just below the threshold drop sharply. This behavior aligns with the design of many apps that grant bonus funds or loyalty multipliers only after the deposit clears, prompting users to consolidate smaller planned transfers into single larger ones.
Yet the same datasets reveal that once users surpass the initial threshold, additional deposits within the same promotional period often decrease until the next cycle resets. Platforms that reset loyalty tiers monthly rather than weekly see steadier weekly deposit volumes, because the longer window reduces the pressure to front-load funds. Operators licensed in Massachusetts have reported similar results after adjusting their structures in early 2026, with regulators noting a 15 percent reduction in clustered deposits after the change.
Loyalty Tiers and Recurring Funding
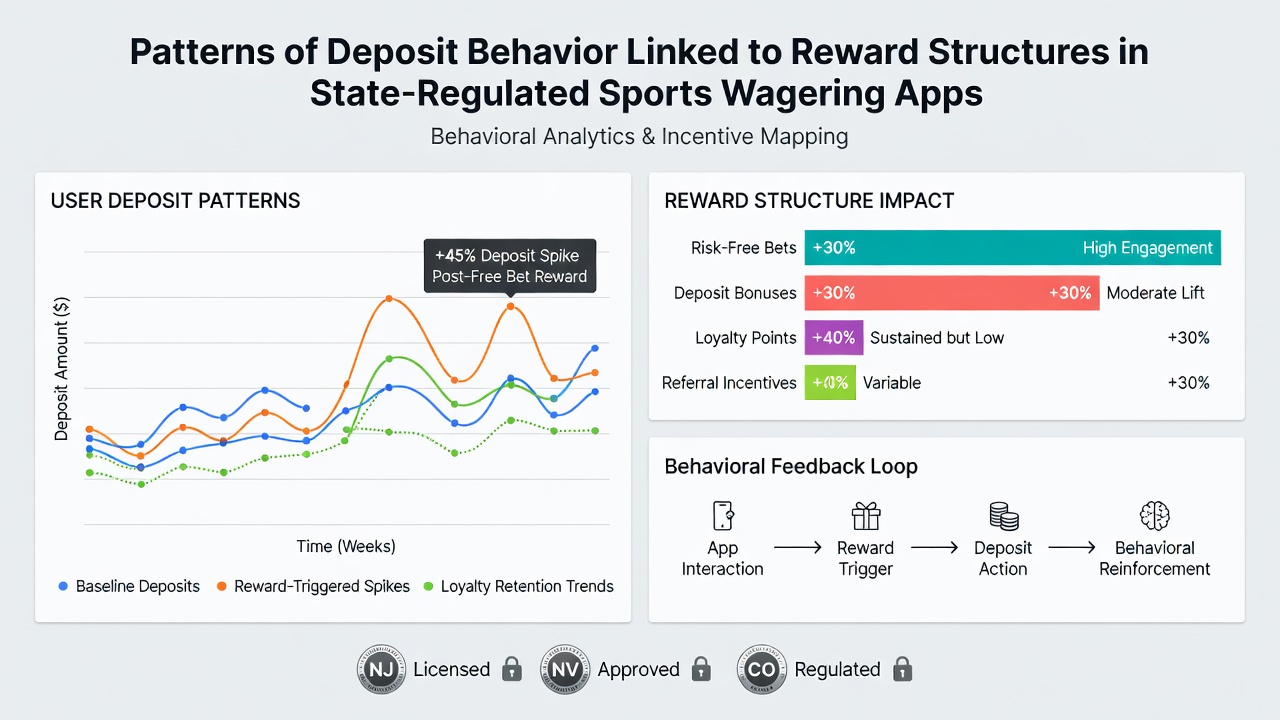
Tiered loyalty programs that award points based on deposit volume rather than wager volume produce distinct patterns, and users at the midpoint of a tier frequently increase deposit frequency to reach the next level before the period ends. Figures from the Illinois Gaming Board covering the first half of 2026 document that users within 20 percent of a tier upgrade deposit an average of 1.8 times more often than those farther from the threshold. These additional deposits tend to be smaller in size, creating a sawtooth effect in account funding records that contrasts with the larger, less frequent deposits observed during welcome-bonus campaigns.
What's notable is how cross-state operators adjust reward structures to account for these behaviors, because users who maintain accounts in multiple jurisdictions often shift deposits toward the platform offering the most attainable tier progress at any given moment. Regulators in neighboring states have begun sharing anonymized deposit-frequency data to identify when one state's promotional calendar influences activity in another, and preliminary findings presented at an industry conference in July 2026 highlighted consistent migration patterns during overlapping loyalty resets.
Impact of Cashback and Loss-Rebate Offers
Cashback structures that return a percentage of net losses on a weekly or monthly basis also shape deposit timing, because users often wait until the rebate posts before making the next deposit. Reports from the Pennsylvania Gaming Control Board indicate that deposits rise within 48 hours of rebate distribution at rates 35 percent above baseline, and the size of those deposits correlates closely with the rebate amount received. This creates a feedback loop where larger losses generate larger rebates that in turn support larger subsequent deposits, a cycle regulators monitor for signs of accelerated play.
Platforms that cap cashback at a fixed weekly maximum see more stable deposit patterns, because the ceiling prevents the rebate from scaling indefinitely with losses. Observers tracking multi-state networks note that users subject to these caps tend to spread deposits more evenly across weeks rather than concentrating activity immediately after rebate payouts.
Regulatory Monitoring and Data Sharing
State regulators have increased their focus on deposit-behavior analytics as reward structures grow more sophisticated, and several commissions now require operators to submit monthly reports that break down deposits by promotion type and user tier status. The Massachusetts Gaming Commission, for instance, began collecting this granular data in late 2025, and its July 2026 summary showed that reward-linked deposits accounted for 62 percent of total handle volume during promotional periods. Similar reporting standards have been adopted or proposed in additional states, creating a growing dataset that allows cross-jurisdictional comparisons.
Industry groups such as the Responsible Gambling Council have contributed independent analyses that examine how these patterns intersect with responsible-gambling tools, including deposit limits and reality checks. Their findings suggest that users who set voluntary deposit caps before engaging with reward programs maintain more consistent funding patterns, whereas those who adjust limits after seeing promotions exhibit higher variance in both timing and amount.
Conclusion
Patterns of deposit behavior in state-regulated sports wagering apps continue to reflect the specific design choices embedded in reward structures, and ongoing data collection by commissions across multiple jurisdictions provides clearer visibility into those connections. As operators refine their offers and regulators expand their monitoring requirements, the relationship between rewards and deposit activity remains a central element of compliance and operational planning throughout 2026 and beyond.